PopPulse Q3 2026 Warehouse Index: Rates Reprice as Shipper Demand Jumps 31%
By Popcapacity Inc. · October 2026

What Happened in Warehousing in Q3 2026?
PopCapacity Research Team | October 2026
Q3 2026 was the quarter warehouse rates caught up. After two quarters in which storage pricing lagged a tightening market, operators repriced across the board: storage on 48×40 pallets, handling in and out, and general labor all moved higher. At the same time, shippers brought 31% more projects to market than a year ago, and operators answered with fewer, more selective bids.
Access the full index here ➡️ PopPulse Q3 2026 3PL Warehouse Data Index
Storage and Handling Rates Caught Up
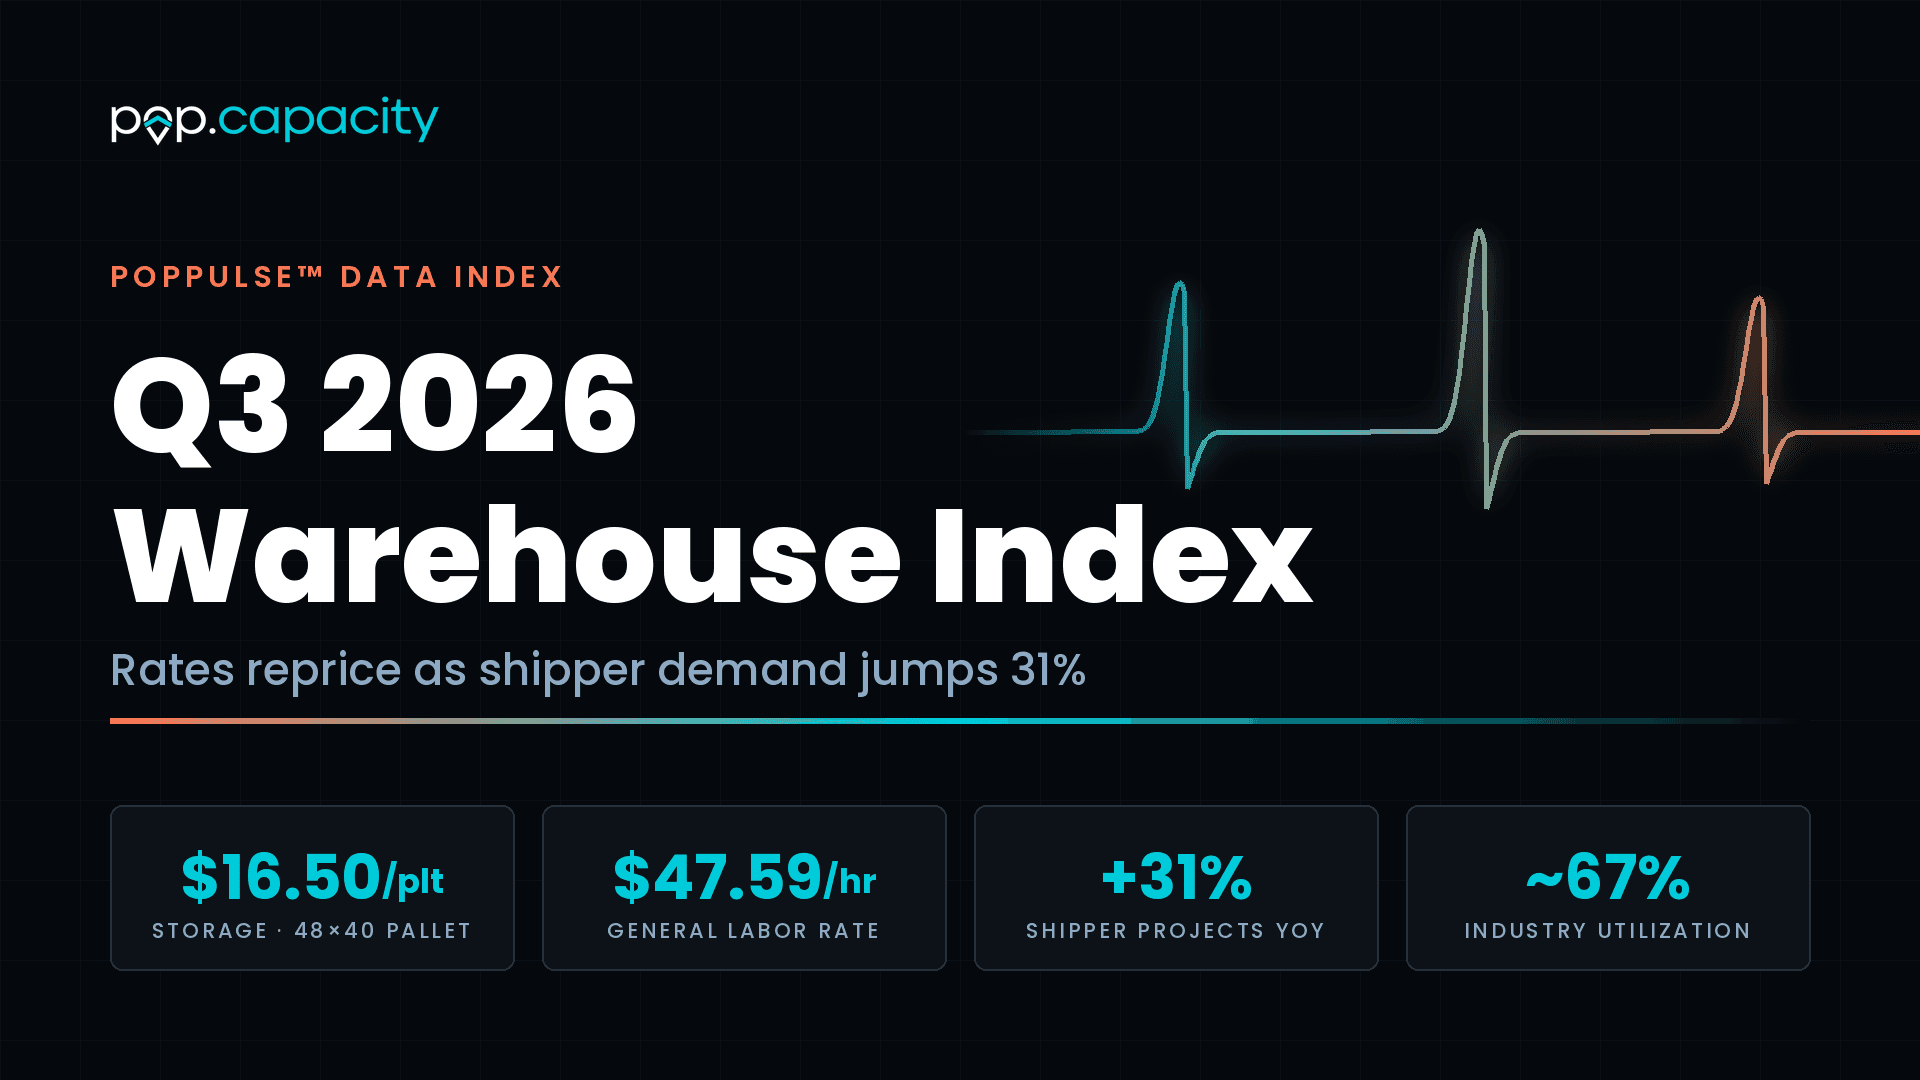
The headline 48×40 per-pallet storage rate rose to $16.50, up 7.1% from $15.41 in Q2. All-pallet storage averaged $17.34, holding above $17.50 in July and August before easing to $16.62 in September.
Handling moved more than storage. Handling-in averaged $9.90 per pallet, up 18% from Q2, and handling-out averaged $9.79, up 15%. Both peaked in August at $10.90 and $10.48.
Labor Hit a New High
General labor rose for a second straight quarter to $47.59/hr, up $2.68 (+6.0%) from Q2. Every month stayed above $46.50, and September reached $48.32/hr, the highest monthly reading of 2026. Unlike Q2, rising labor was matched by rising storage and handling, easing the margin squeeze operators felt last quarter.

Storage and handling rates rose in Q3, with handling peaking in August.
Shipper Demand Re-Accelerated
Shippers created 51 projects in Q3, up 31% year-over-year from 39 in Q3 2025 and a clear re-acceleration from Q2's roughly 3% growth. Those projects asked for about 4.0 million sq ft of space, roughly four times Q3 2025's volume.
Operators Got Selective
Operators returned 135 proposals, down 38% from Q2's 218 and 32% from 199 a year earlier. Proposal activity rebuilt month by month (32 in July, 46 in August, 57 in September), but bid coverage fell to about 2.6 proposals per project, from about 3.1 in Q2 and 5.1 in Q3 2025. More projects, fewer bids and higher quoted rates describe a market where operators can afford to choose.
Utilization Eased While Rates Rose
Utilization moved the other way, easing from June's 72% to 69.6% in July, 67.4% in August and 62.8% in September, for a quarterly estimate of ~67%. Firmer rates alongside looser occupancy suggest operators are holding price and quoting selectively rather than discounting to fill space.
The Southwest Returned to the Lead
Demand spread more evenly than in the prior two quarters. The Southwest led on both deal flow (34.7%) and space demand (35.4%), with Texas alone contributing 11 projects. The Midwest ranked second by deal flow at 22.4%, and the Southeast (18.6%), Midwest (18.1%), West Coast (14.8%) and Northeast (13.0%) each held a meaningful share of space demand.
Consolidation and Multi-Hub Networks
Q3's largest projects were multi-market programs rather than single sites. A toys and novelties inventory-consolidation program registered identical 28,874-pallet projects in Phoenix, Las Vegas and Reno, plus a fourth in Chino, California. Together those four represent about 1.73 million sq ft, roughly 44% of all Q3 space demand. The single largest project was a 46,000-pallet Class IV hub in Memphis, paired with a 33,950-pallet companion hub in Washington, D.C.
Food, Beverage and Solar Broadened
Toys led by project count for the second straight quarter, but the demand came from consolidating aged inventory rather than a holiday build. Solar found a third geography in Indiana, with a 360,000 sq ft modules project in Indianapolis. Food and beverage broadened: tomato-product pouches appeared in four projects across North Carolina, Virginia and Ohio, and canned functional beverages in four more across Texas, California and Ohio. Temperature-controlled demand shifted to chilled pet food (34–36°F) and food-grade pet products.
What to Watch in Q4 2026
Does the rate recovery hold? Storage and handling rose in July and August, then eased in September. Watch the 48×40 rate against Q3's $16.50.
Labor above $48. Peak-season staffing typically adds wage pressure. A quarterly average above $48/hr would mark a third straight quarterly increase.
The proposal gap. If bid coverage stays near 2.6 proposals per project, shippers should expect fewer competing quotes and less pricing leverage. Sourcing earlier will matter more.
Inventory consolidation into peak. Q4 will show whether more brands move aged inventory into lower-cost markets ahead of the new year.
Multi-hub network builds. The Memphis/D.C. pairing and the four-market toys program point to shippers sourcing space as networks. Watch for more paired or multi-market projects.
Utilization. A rebound toward the low 70s would mark Q3 as a pause. Further easing alongside firm rates would point to operators protecting price over occupancy.
Access the full index here ➡️ PopPulse Q3 2026 3PL Warehouse Data Index
About the data: PopPulse™ is built from live proposal and project data on the PopCapacity platform, not survey responses. Q3 2026 covers July 1 to September 30, 2026: 135 operator proposals, 51 shipper projects and a tracked network of 1,557 facilities (~342 million sq ft). Rates are 5th–95th percentile trimmed means. Full methodology is in the index.